
#Biketooter :When planning a #bike #route with #FOSS and #OSM based #routing engines, such as #Brouter / #Bikerouter ,the result analysis frequently shows some #surface percentage as "unknown". I guess that's because the #information is missing in the #OpenstreetMap #database .However, when I upload the same track as #GPX into a #commercial #biking application, such as #Komoot or #Cyclers ,the "unknown" has disappeared, while they are also based on OSM. How come?
Frühere Suchanfragen
Suchoptionen

#gpx
2 Beiträge2 Beteiligte0 Beiträge heute

WTF moment of the day: You cannot, by any means, export custom POI lists from Google Maps.
I mean, I anyway wanted to get away from Google Maps, but hey come-on, you can export starred places and your reviews, but not the fuckin lists?!
I had to workaround and add all 150 castles my wife and me visited to starred places to get them exported...
Then converting the geojson to gpx and import to OsmAnd. Done. All locations in OsmAnd and always the possibility to export/import, do what the fuck you want with the data you created yourself. FREEDOM!
Auf Nimmerwiedersehen Google Maps, gtfooml (get the fuck out of my life).

More progress on my GPS , GPX comparison tracker!
Still not what I want, but I am getting close!
To do:
 I want to move the data labels to a tableCalculate the difference between themcolor the faster daychange the day to a colored dot matching the tracksort them the fastest on top….
So close and yet so far! 
GIF
Antwortete im Thread

@mascho_7 @radkolumne Auf unserer Webseite gibt es viele Infos (Bilder, Karten, #gpx) dazu, auch zu dem Radweg bei #Schmalkalden:
https://www.bahntrassenradwege.de/index.php?page=Mommelstein-Radweg
... und zu dem bei #Görlitz:
https://www.bahntrassenradwege.de/index.php?page=G%C3%B6rlitzer+Kreisbahnradweg
Und das hier ist ein Verzeichnis fast aller #Radwege auf stillgelegten #Bahntrassen:
www.bahntrassenradwege.deBahntrassenradwege
I have lots of favorites (starred places) in #OSMand and I want to view them on a map on a bigger screen, not just on the phone. When I export them, I get a favorites.gpx file.
As far as I understand, these are waypoints on a track?
I opened the file in the nextcloud map, and it displays the points, but without any text.
The entries look like this:
<wpt lat="51.5320587" lon="-0.1773316">
<time>2025-01-18T22:23:30Z</time>
<name>Abbey Road Crossing</name>
<extensions>
<osmand:amenity_subtype>attraction</osmand:amenity_subtype>
<osmand:address>Abbey Road (South Hampstead), Camden Town</osmand:address>
<osmand:amenity_origin>Amenity:Abbey Road Crossing: tourism:attraction</osmand:amenity_origin>
I tried converting the file to (geo)json, but so far the file has come out empty. I realize I don't really know what I'm looking for. It doesn't have to be nextcloud compatible at all, that was just the first thing I had on hand.
I would like to see the points and their names on a map on a bigger screen.
Any suggestions please?
#BendingSpoons is a #PrivateEquity firm. #Komoot #bike users should download their already ridden or planned #tracks as #GPX files as soon as possible before they have to pay a lot for them (or even to get a #map update). Better alternatives to Komoot: #Routing with #Brouter , #Cyclers , #VisuGPX or #Valhalla ; (free) navigation with #OrganicMaps or #CycleTravel . Everything else (photos, etc.) is anyway a #socialmedia feature.
#BikeTooter #fahrrad #vélo #cyclotourisme
https://road.cc/content/news/job-cuts-expected-komoot-after-tech-firm-purchase-313159
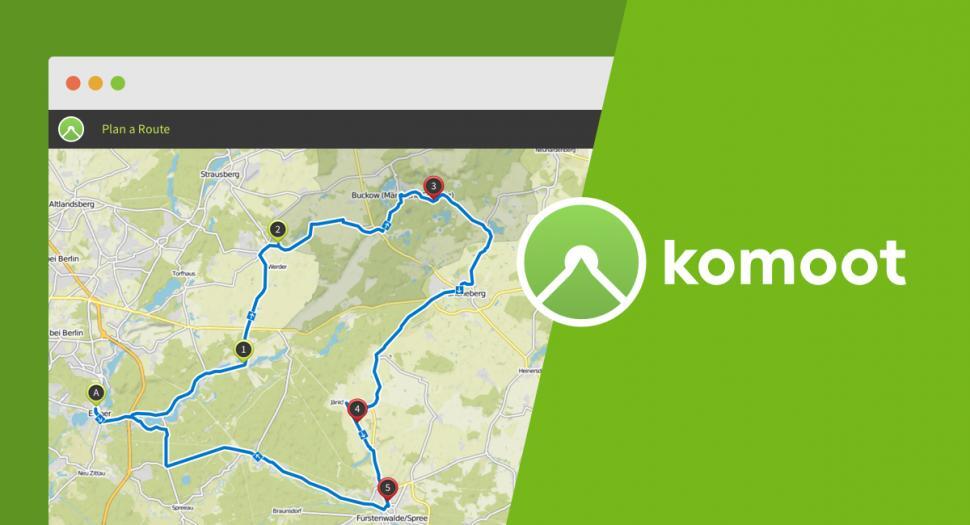
road.cc · “Totally blindsided”: Cuts and job losses expected at Komoot after route planning app bought by Italian tech firm infamous for mass layoffsKomoot employees say they have been “blindsided” by Bending Spoons’ purchase, which comes after the brand introduced a new premium subscription for users to send routes to bike computers

Mon premier #50pasouf avec mon nouveau #vélo à ma taille. Depuis ~Orly pour un tour de la forêt de Sénart. Du bleu, un peu de vent, des fleurs, des arbres, la nature, les pitizoizo, la Seine, du single au bord de l'eau, du gras, les pieds dans la gadoue à en boucher les cales, et une côte de dingo pour remonter de la Seine sur le plateau à Juvisy  . Mais c'était trop bien !
 Si vous voulez le #gpx... @emeline


Playing with some #GPX data for an upcoming #TrailRunning race. Two different tools come up with wildly different total elevation gain/loss numbers: Garmin says 2,600 feet and GPS Visualizer says 5,200. Just for fun, I asked Strava and they said 3,000. Evidently nobody can agree.
I think Garmin is closer to reality here, although GPS Visualizer talks a big game about the myriad elevation data sources they enlist. You can see in the attached image that the Garmin elevation profile is much smoother than the more jittery GPS Visualizer profile. I think all that jittering is the source of most of the additional 2,600 feet, although GPS Visualizer does think that some peaks are >100 feet higher than Garmin does.
If you find yourself wanting precise elevation data, who do you typically turn to?

More progress on my gps /gpx comparison tracker!!
The basis of the script to compare the tracks is here:
https://codeberg.org/Curbal/compare_gps_gpx_tracks/src/branch/main/compare-gps.py
So much fun to do… and it looks like I am getting faster!… kindof 

 Eljo #MorpurgoMedia
 Fietsen rond Amstelveen (Preview)
https://www.morpurgomedia.nl/columns-blogs/2025/2025-03/fietsen-rond-amstelveen

Antwortete im Thread


@escuco @FitTrackee
Das funktioniert ausgezeichnet. Ich bin sehr zufrieden mit der Software und vor allem mit deinem Service.
Habe über 100 Aktivitäten schon hochgeladen und kann anhand der Statistiken mir ein Bild der sportlichen Aktivitäten machen. Datenschutzfreundlicher geht es nicht.
Die Daten erhalte ich mittels "FitoTrack".
Made some progress on my script to compare gps / gpx tracks.
It now loops over my workouts and gives me the f-score (frechet distance) in a neat dataframe so I can then compare the stats on similar workouts.
I still need to decide on a proper f-score threshold, but for what I have seen so far it looks like less than 0,002
More to come!


Antwortete im Thread
@tillmanreuter @organicmaps Thank you for your reply. However, on my #OrganicMaps (downloaded from #FDroid ) it does not seem possible to modify #GPX tracks which have been created elsewhere and then are uploaded to the application. Do I miss something?
#FediAsk / #BikeTooter : Is there a #free and #opensource software ( #FOSS ) on #Android for #bike #navigation which allows to upload a #GPX route, *easily* and quickly modify it before as well as *during* navigation, and at the end download the GPX file? I love the #OsmAnd navigation tool, but, since I am by far not a #geek ,somehow fail to quickly modify the tracks.
Thank you.
Antwortete im Thread
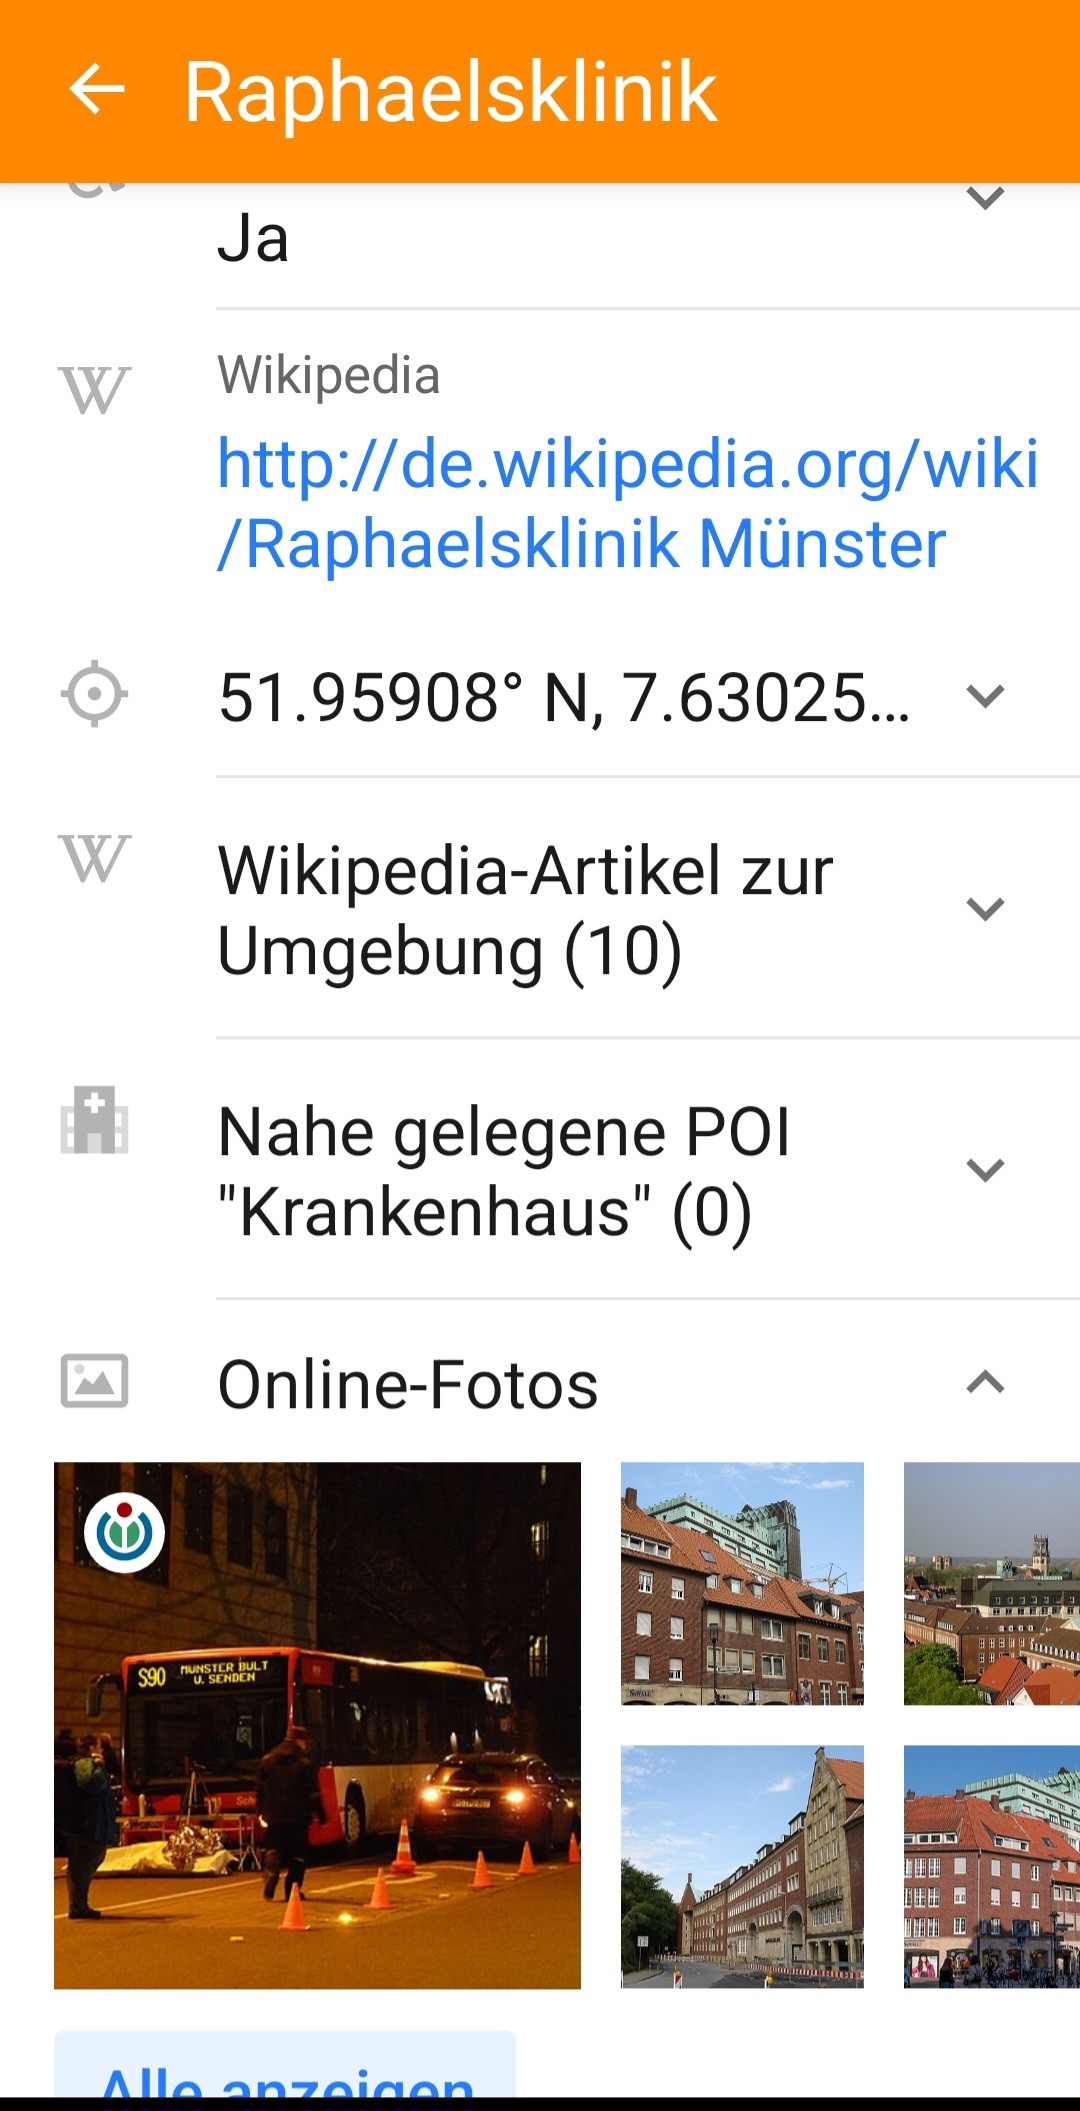
#openstreetmap und #Umap für #gpx und co.
#Bilder und co geht ja schon länger direkt.
Die müssen aber wirklich noch von UNS gefüllt werden.
Ebenso etliche Wikipedia Einträge in der Umgebung
Willkürlich gesucht.


Heut eine interessante Alternative zu #Komoot gefunden:
wanderer DocumentationWelcome to wandererThe self-hosted trail database
I can now compare two gps or gpx tracks to see if they are the same 
Why is that useful? I will be able to compare activities on the same track! I am running faster? Slower ? How is the cadence? ….
Too tired to continue now, maybe tomorrow if I have time!


Wie ich meine erdachten/gefundenen #GPX-Routen speichere?
Als #Lesezeichen im Browser.
Mein Workflow, wenn ich eine Strecke plane oder auf dem #Garmin haben möchte:
- #GPX erstellen (bevorzugt mit bikerouter.de, weil es gibt nichts besseres!)
- GPX Datei auf Garmin kopieren (#Cloud Sync von Garmin oder File-Sync am Desktop)
Fertig.
Wüsste gar nicht, wobei ich mit #Komoot einen Vorteil gehabt hätte, wenn ich die Plattform genutzt hätte, die mit dem Verkauf von #OSM-Karten Geld macht(e).